


 10 / 96

9
2016 |
№3
ТЕОРИЯ И ПРАКТИКА ПЕРЕРАБОТКИМЯСА
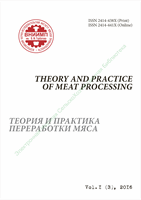
и в продуктах убоя животных (№ 3). Однако и в мясе
и в продуктах убоя, полученных от животных из хо-
зяйства № 1 и 5, они были выявлены.
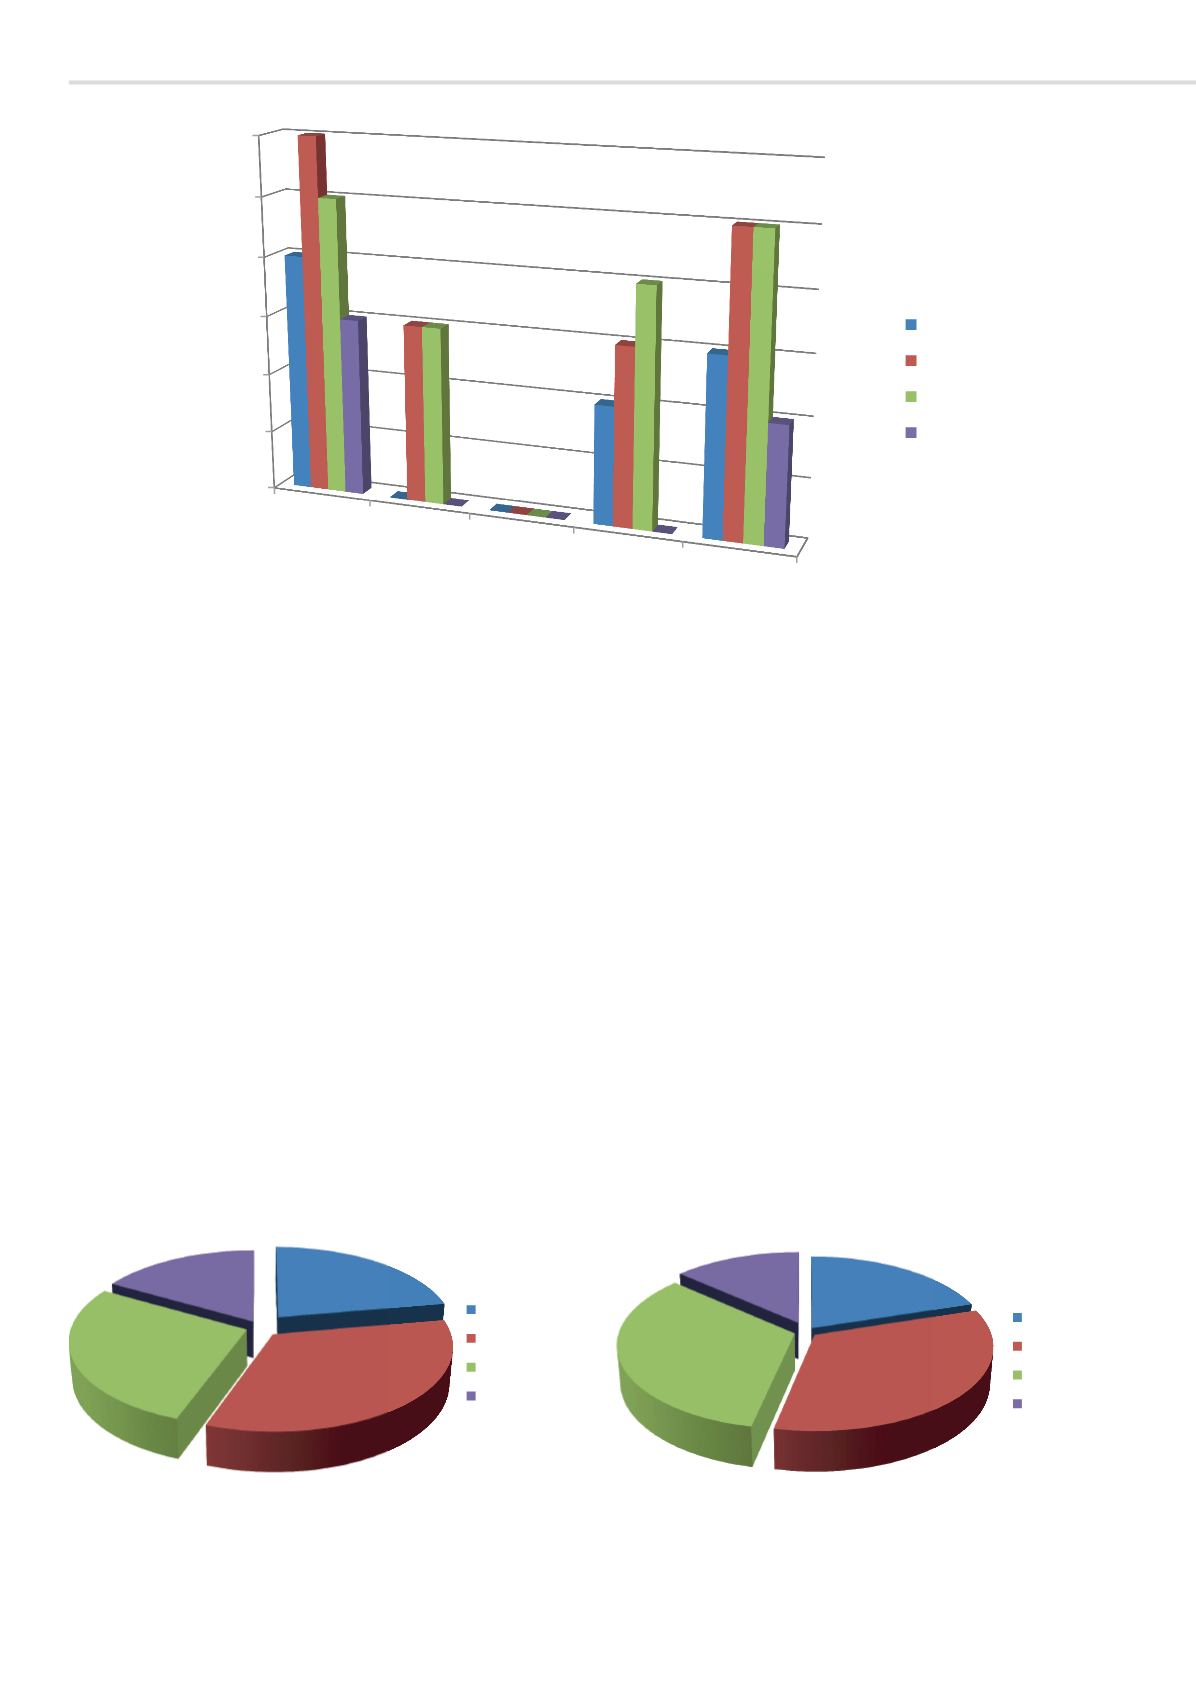
Анализируя эти данные (рис. 2 и 3), было установ-
лено, что распределение антимикробных препаратов
в мясе и продуктах убоя от одного животного следу-
ющее: в печени — 33 %, в почках — 28–33 %, в мясе —
20–22 %, и меньше всего в жире — 14–17 %.
Например, в работе Закревского В.В. и Лелеко С.Н.,
которые проводили оценку мясного сырья, поступаю-
щего на мясоперерабатывающие предприятия Санкт-
Петербурга из разных стран мира, приведены данные
исследования говядины, произведенной в РФ, на на-
личие остаточных количеств антибиотиков (тетраци-
клин, стрептомицин и левомицетин). Авторами было
установлено, что 25 % исследованных образцов говя-
дины были контаминированы [4].
В наших исследованиях бы использован скринин-
говый метод, с помощью которого можно обнаружить
However, they were revealed both in meat and products of
animal slaughter obtained from the animals from enter-
prises No. 1 and 5.
When analyzing these data (Fig. 2 and 3), it was found
that distribution of antimicrobials in meat and products of
animal slaughter from an individual animal was as follows:
33 % in liver, 28–33 % in kidney, 20–22 % in meat, and the
least amount (14–17 %) in fat.
Zakrevsky V.V. and Leleko S.N., who assessed meat raw
material delivered to meat processing enterprises of Saint
Petersburg from different parts of the world, presented
in their works the data on examination of beef produced
in the RF on the presence of the antibiotic residues (tet-
racycline, streptomycin and levomycetin). The authors
established that 25% of the tested samples were contami-
nated [4].
Figure 1. Results of analysis of meat and products of cattle slaughter for the presence of different amounts of antimicrobials
Рис. 1. Результаты исследования мяса и продуктов убоя КРС на наличие остаточных количеств антимикробных препаратов
0
1
2
3
4
5
6
Group 1 |
1
Group 2 |
2
Group 3 |
3
Group 4 |
4
Group 5 |
5
Group of animals from di erent enterprises |
meat |
liver |
kidney |
fat |
Zone of test culture inhibition,mm |
-
,
Figure 2. Diagram of antimicrobial distribution in meat and products
of cattle slaughter from enterprise No.1
Рис. 2. Диаграмма распределения остаточных количеств анти-
микробных препаратов в мясе и продуктах убоя КРС из хозяй-
ства № 1
Figure 3. Diagram of antimicrobial distribution in meat and products
of cattle slaughter from enterprise No.5
Рис. 3. Диаграмма распределения остаточных количеств анти-
микробных препаратов в мясе и продуктах убоя КРС из хозяй-
ства № 5
22%
33%
28%
17%
meat |
liver |
kidney |
fat |
22%
33%
28%
17%
meat |
liver |
kidney |
fat |
20%
33%
33%
14%
meat |
liver |
kidney |
fat |
Электронная Научная СельскоХозяйственная Библиотека