


 8 / 68

INTERNATIONAL AGRICULTURAL JOURNAL № 6 / 2016
www.mshj.ru6
THE MAIN THEME OF THE MAGAZINE
For the same index, Romania got zero points as
her respective change for the same period was the
lowest (-20%). Similarly, Estonia increased her in-
dustrial crop output to the most in the period an-
alysed (+173%), while Slovenia actually showed a
decrease in this regard (-19%) — thus Estonia got
100 points and Slovenia zero (check the third col-
umn of
Table 1
).
Another common way to analyse agricultur-
al performances is to check real farm incomes
growth (Index 8). Although farm income per cap-
ita increased in each and every country in the re-
gion, Estonia experienced the biggest increase of
farm income per capita after accession (222%),
while farmers’ income increased the least in Roma-
nia (+16%).
Another group of indicators measures agricul-
tural productivity. The first such indicator is gross
value added per hectare that measures land pro-
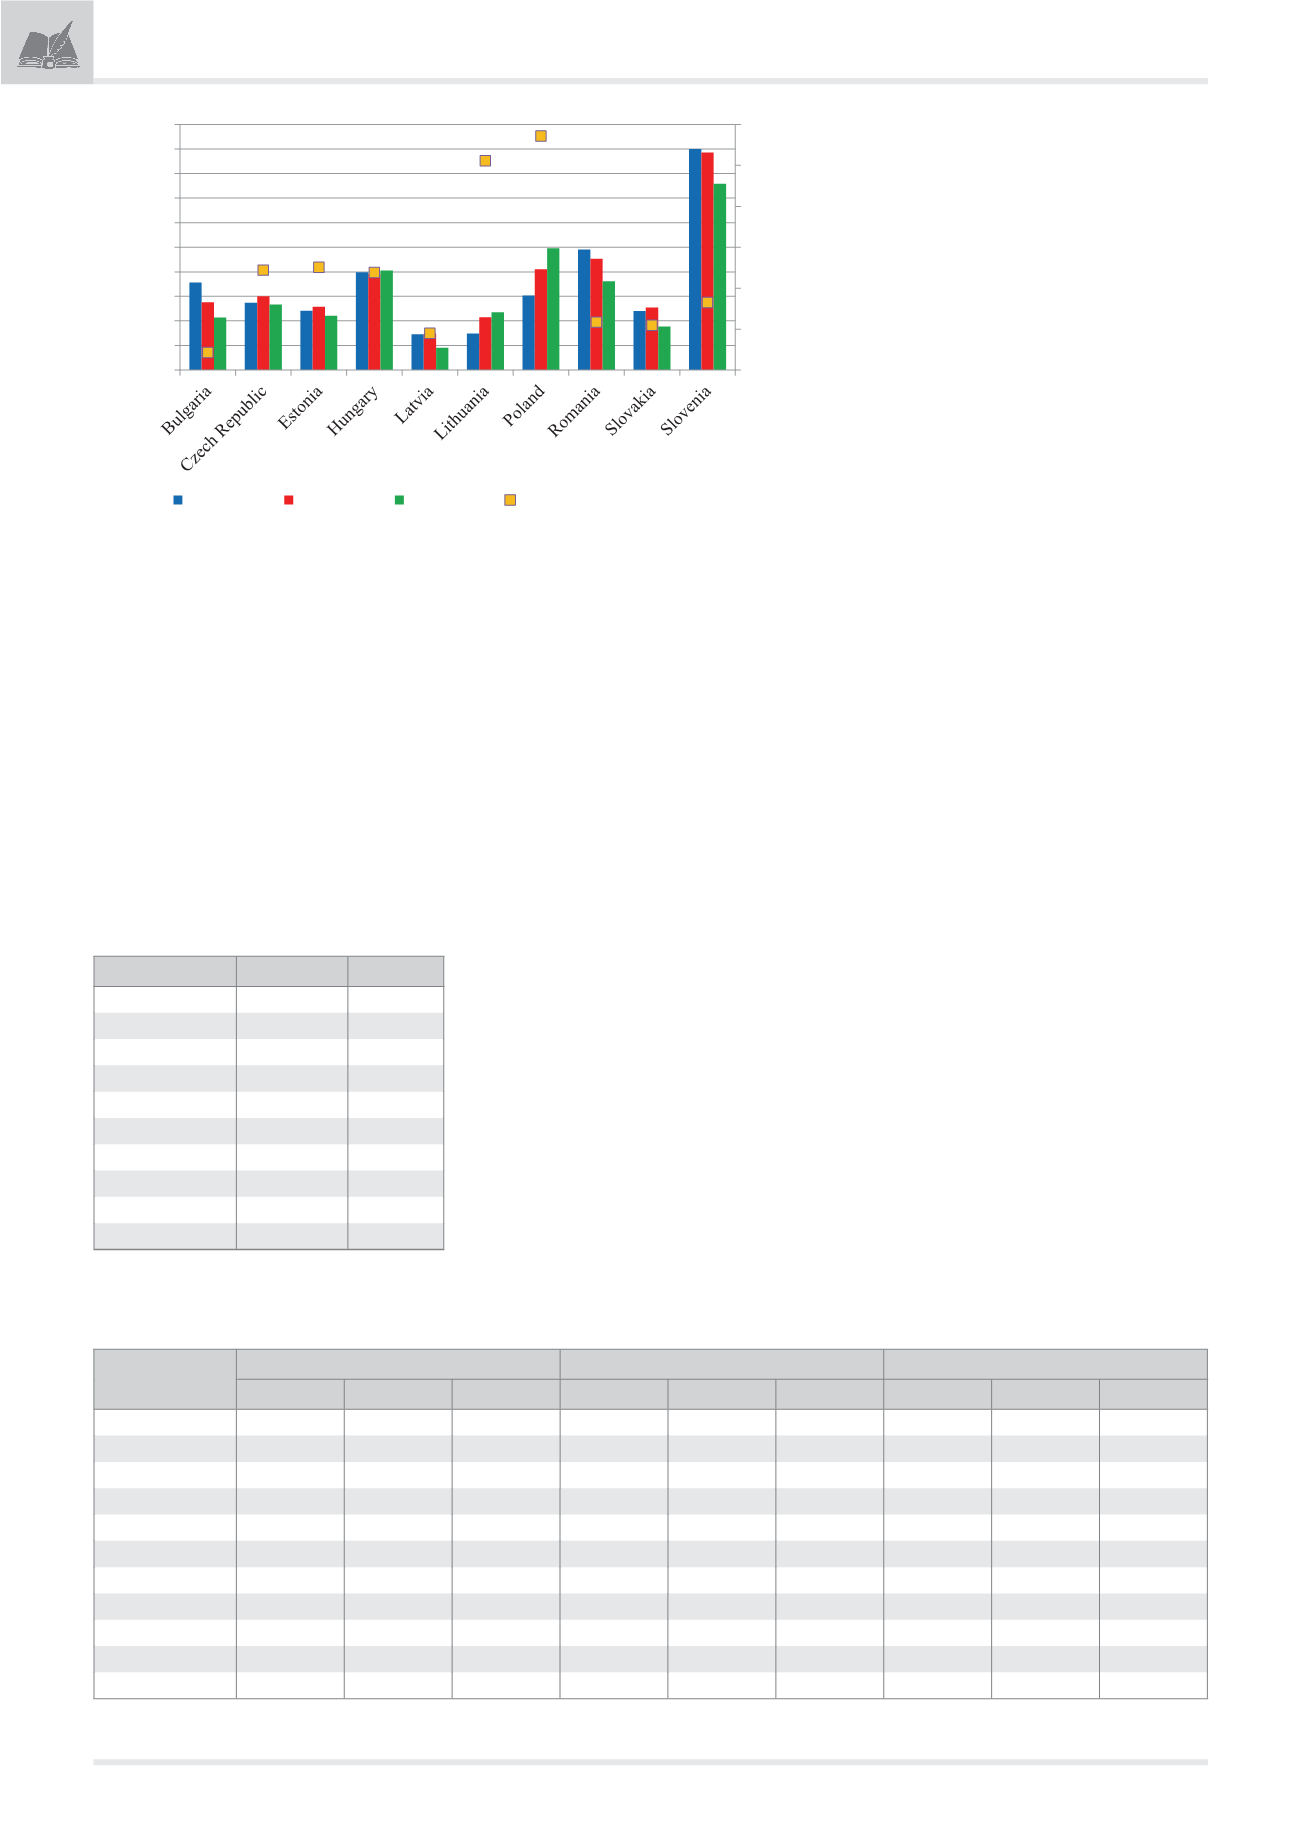
ductivity (Index 9). Contrary to
Figure 1
, it is evident
that gross value added per hectare was the highest
in Slovenia in all periods analysed, while the lowest
in Latvia (
Figure2
). However, in terms of changes, Po-
land could increase her per hectare output by 59%
from the first to the last period, while the respective
change for Bulgaria was -37%). Thereby Poland got
100 points for Index 9 and Bulgaria got zero.
Agricultural productivity can also be measured
per worker (Index 10). Results suggest that Estonia
actually more than doubled her gross value added
per worker, while Slovenia even experienced some
decrease with respect to this index.
The remaining indices capture agricultural pro-
ductivity by sector. As evident from
Table 1
, Estonia
leads the line here in most cases, while relatively
low values can be seen for the Czech Republic and
Hungary.
The agricultural performance index is calcu-
lated by summing up the 15 indices. There exists a
huge competition among NMS regarding their final
ranks (
Table 2
). Poland became the first, preceding
Estonia and Lithuania—all obtained scores around
1000. Latvia reached the fourth position, while the
Czech Republic got to the fifth. On the other hand,
Hungary, Slovakia, Slovenia, Romania and Bulgaria
lagged behind. Note that their score does not even
reach 50% of the winners. On the whole, Poland
and the Baltic countries seem to have gained the
most with EU-accession in agriculture while coun-
tries with scores below 500 have used their possi-
bilities of EU accession the least in the agricultural
sector.
We are aware that our approach has many limi-
tations. First, it is evident that the selection of indi-
ces can alter the final performance of the countries.
Second, ranks can also change by the selection of
new periods to compare. Third, we are not certain
whether these changes would anyway have hap-
pened or they are an effect of EU accession. Fourth,
there might be some correlations between the se-
lected indicators which can over represent the per-
formances. However, we believe that our selection
of 15 different indices shows trends close to reality.
5. Possible reasons behind
There can be many external reasons behind the
different performances described above. First of
all, these countries have different initial conditions.
Different distribution of agricultural land quality
and quantity together with the differences in ag-
ricultural labour and capital endowment definitely
had an impact.
As evident from
Table 3,
Poland and Romania
had the biggest agricultural land, labour and capi-
tal endowment in the NMS. However, only Estonia
and Latvia could increase their agricultural land
area from 1999-2003 to 2009-2013, while agricul-
tural labour decreased in each and every NMS. On
the other end, agricultural capital increased in all
countries but Bulgaria, Hungary, Slovakia and Slo-
venia. It can be observed from
Table 3
that mainly
those countries, where changes in factors of pro-
duction were better than the regional average, per-
formed better.
Besides initial conditions, another factor behind
different country performances lies in farm struc-
tures (
Figure 3
).
-50%
-30%
-10%
10%
30%
50%
70%
0
100
200
300
400
500
600
700
800
900
1000
1999-2003 2004-2008 2009-2013 Change (2009-2013/1999-2003)
Figure 2. Changes in agricultural gross value added per hectare in real terms in the NMS, 1999-2013
(euro/ha and percentage)
Source: Own composition based on Eurostat (2015) data
Table 2
The agricultural performance index of the NMS
Country/Index Total Score
Rank
Poland
1084
1
Estonia
1060
2
Lithuania
985
3
Latvia
725
4
Czech Republic
558
5
Hungary
497
6
Slovakia
455
7
Romania
443
8
Slovenia
412
9
Bulgaria
399
10
Source: Own composition
Table 3
Changes in factors of production in the NMS, 1999-2013
Country
Utilised Agricultural Area (1000 ha)
Agricultural labour (1000 AWU)
Gross fixed ag. capital (million euro)
1999-2003 2009-2013
Change
1999-2003 2009-2013
Change
1999-2003 2009-2013
Change
Bulgaria
5482
5058
-8%
770
377
-51%
160
122
-24%
Czech Republic
4038
3524
-13%
165
108
-34%
340
462
36%
Estonia
881
950
8%
57
25
-56%
76
138
82%
Hungary
6169
5428
-12%
654
440
-33%
911
725
-20%
Latvia
1763
1833
4%
146
87
-41%
101
156
54%
Lithuania
3066
2800
-9%
194
145
-26%
211
308
46%
Poland
17543
14789
-16%
2414
1979
-18%
696
901
29%
Romania
14802
13897
-6%
3175
1692
-47%
694
799
15%
Slovakia
2315
1928
-17%
136
62
-54%
153
125
-18%
Slovenia
507
474
-7%
104
80
-23%
211
193
-9%
NMS total
56566
50680
-10%
7815
4995
-36%
3553
3928
11%
Source: Own composition based on Eurostat (2015) and FAO (2015)
Электронная Научная СельскоХозяйственная Библиотека