


 7 / 68

МЕЖДУНАРОДНЫЙ СЕЛЬСКОХОЗЯЙСТВЕННЫЙ ЖУРНАЛ № 6 / 2016
5
ÌÑÕÆ — 60 ëåò!
ГЛАВНАЯ ТЕМА НОМЕРА
in the region but also horizontal IIT. He found that
differences in country size and income were posi-
tively related to IIT as is FDI, while distance and IIT
showed a negative relationship. Bojnec and Fertő
(2015) analysed the price and quality competitive-
ness as well as comparative advantage in EU coun-
tries agri-food trade and found that new and old
member states have become more similar in suc-
cessful agri-food competitiveness and comparative
advantages.
Policy-oriented analysis of the lessons of acces-
sion can be found in Möllers et al. (2011) who inves-
tigated the changes in agricultural structures and
rural livelihoods in the NMS and reached several
agricultural policy conclusions, especially regard-
ing the ongoing debate of the Common Agricultur-
al Policy. Gorton et al. (2009) analysed why the CAP
does not fully fit the region and identified several
reasons valid for the NMS. Csáki and Jámbor (2013)
analysed the impacts of EU accession on NMS agri-
culture and concluded that EU accession has had
an overall positive impact, although member states
capitalised their possibilities in a different man-
ner. Kiss (2011) echoed the above conclusion and
added that accession has created an incentive to
NMS agriculture but also had negative effects due
to tough competition in the enlarged market. So-
mai and Hegedüs (2015) investigated the speed of
changes in NMS agri-food sector after accession
and concluded that Poland and the Baltic countries
showed the best performances regarding overall
development. Szabo and Grznár (2015) analysed
the Slovakian position in EU agriculture and ranked
it in the last in their sample due to low input of fixed
assets, intermediate product, livestock units, but
also a lower volume of the provided subsidies than
the advanced countries.
3. Methodology
In line with the aim of the chapter, an innova-
tive tool (the agricultural performance index) is
used to analyse the post-accession agricultural per-
formance of the NMS. The agricultural performance
index is similar to those generally applied by inter-
national organisations to measure and compare
economic performance of a group of countries
(e.g. Global Competitiveness Index, Environmen-
tal Performance Index, etc.). Just like in the associ-
ated reports, past performance is ranked through
different indicators and then aggregated into one.
A similar approach is applied here as 15 different
agriculture-related indicators is captured and then
aggregated to get the agricultural performance in-
dex. Except for Csaki (2004) who used a similar logic
to assess the status of transition, this approach has
not been used to the agri-food sector so far.
The paper analyses agricultural performance of
NMS in 1999-2013. This period is subdivided into
three equal periods (1999-2003, 2004-2008, 2009-
2013) to better assess the impacts of EU accession.
An average for all sub-periods is calculated for each
of the 15 indicators and then averages of the first
and last periods are compared. In order to manage
negative results (i.e. negative changes in specific in-
dicators in time), the value of the smallest average,
pertaining to a country, is added to all countries’
respective changes (changes from 1999-2003 to
2009-2013) and then final scores by country are giv-
en in percentage of the highest value. This method
enables us to give 100 points to the best perform-
ing country (i.e. the country with the highest posi-
tive change for an indicator) and continuously less
to those performing worse. As countries are ranked
on the basis of their own performance, initial differ-
ences among countries do not play a role. The list
of the 15 indicators selected is given in Appendix 1.
As a major source, the paper uses the Eurostat
database but FAO andWorld Bank datasets are also
used in some cases. Note that Cyprus and Malta are
excluded from the analysis because of the marginal
importance of the agricultural sector in their econ-
omies compared to other NMS. Croatia is also ex-
cluded on the basis that her 2013 accession does
not allow any impact analysis considering the time-
frame of the sample. We are also aware that the
2007 accession of Bulgaria and Romania slightly
changes the interpretation of our results, though
we still think that the performance of these coun-
tries are comparable to other NMS based on histori-
cal and geographical reasons.
4. Agricultural performance indices
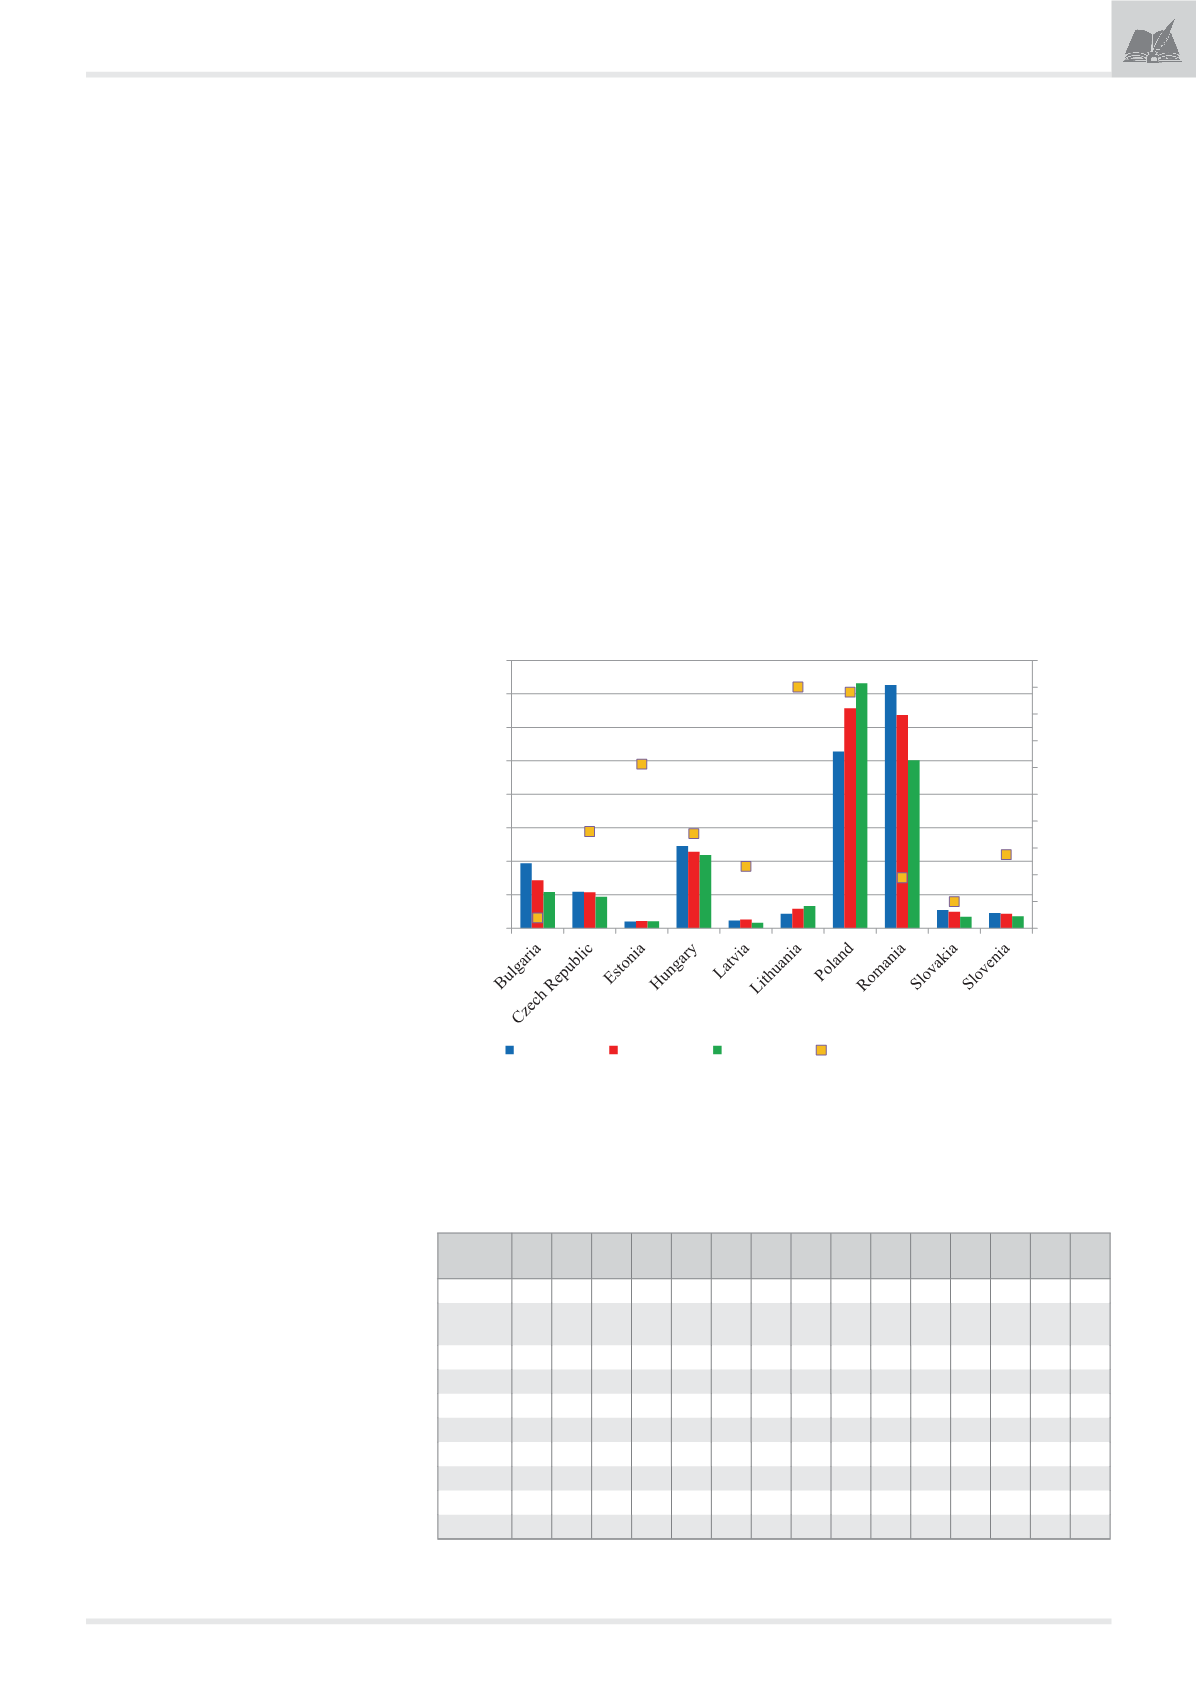
The first indicator describing the performance
of agriculture is gross value added at real prices.
There are very significant differences in this regard
among NMS (
Figure 1
). On the one hand, Slovenia
had a gross value added of 759 euro per hectare
on average in 2009-2013, while Latvia could only
reach 90 euro per hectare at the same time. What is
more important, only Estonia, Lithuania and Poland
could increase gross value added in agriculture af-
ter accession, while huge falls are observable in the
others (including Bulgaria’s sharply decreasing per-
formance of 44% from the first to the last period
analysed).
It is evident from
Figure 1
that Lithuania be-
came the first in agricultural gross value added
performance (showed the highest increase from
1999-2003 to 2009-2013), thereby received a score
of 100. On the other end, Bulgaria showed the big-
gest fall here and got zero points (see first column
of
Table 1
).
Agricultural performance can also be measured
by sector. Indices 2-7 actually capture country per-
formances by their diverging sector outputs. For
instance, Lithuania doubled her cereals output
from 1999-2003 to 2009-2013 (from 262 million to
539 million euro), thereby obtaining 100 points for
the second index (see second column of
Table 1
).
Figure 1. Changes in agricultural gross value added in real terms in the NMS, 1999-2013
(euro/ha and percentage)
Source: Own composition based on Eurostat (2015) data
-50%
-40%
-30%
-20%
-10%
0%
10%
20%
30%
40%
50%
0
1000
2000
3000
4000
5000
6000
7000
8000
1999-2003 2004-2008 2009-2013 Change (2009-2013/1999-2003)
Table 1
Summary of agricultural performances in NMS
Country/
Index I1 I2 I3 I4 I5 I6 I7 I8 I9 I10 I11 I12 I13 I14 I15
Bulgaria
0
44 73 6
0 0
28 6
0
7 17 33 53 76 56
Czech
Republic 37 25 26 27 96 31 48 47 38 21 18 28 28 59 29
Estonia 67 77
100
3 73 82 84
100
39
100 100 0 100 100
35
Hungary 37 41 36 38 38 45 23 31 37 17 3 62 19 25 45
Latvia
22 82 73
0
63 67 85 55 9 15 78 12 57 69 38
Lithuania
100 100
69 79 28 78 79 52 89 58 41 53 45 81 33
Poland 98 48 53
100 100 100 100
63
100
46 17 92 30 56 81
Romania 17
0
32 49 59 13
0 0
14 18 35 100 17
0
89
Slovakia 7 25 25 23 44 14 23 35 13 25 32 62
0
27
100
Slovenia 27 7
0
88 64 43 43 5 23
0 0
57 3 52
0
Note: The detailed list of indices can be found in Appendix 1.
Source: Own composition
Электронная Научная СельскоХозяйственная Библиотека