


 20 / 736

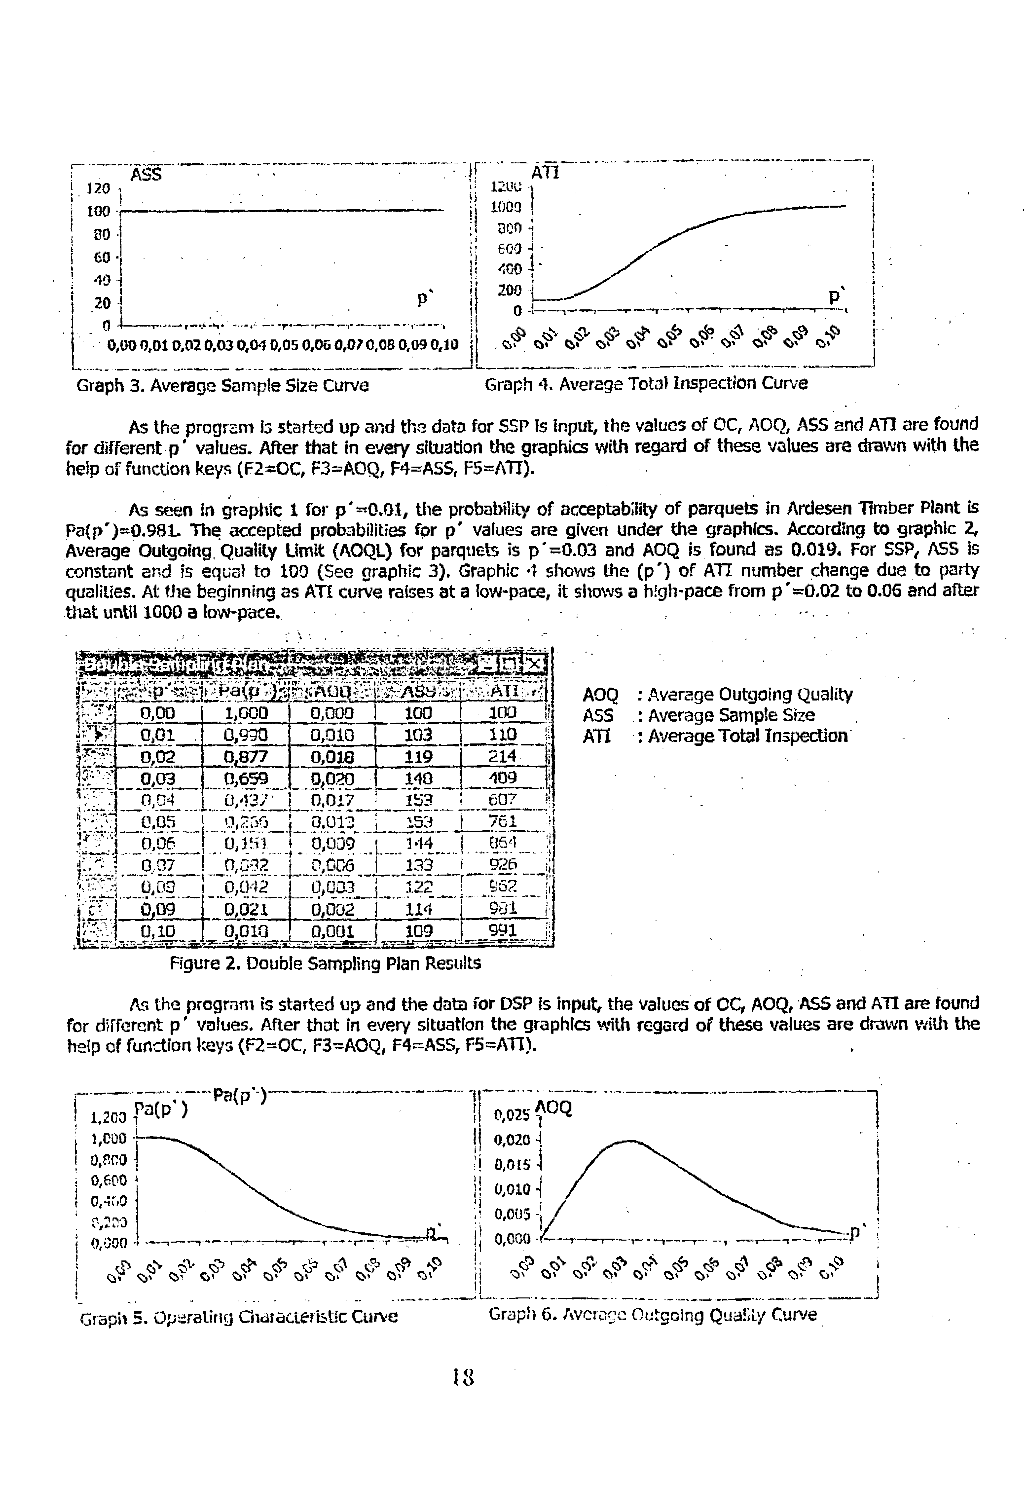
Graph 3. Average Sample Size Curve
Graph 4. Average Total Inspection Curve
As the program is started up and the data for SSP is input, the values of OC, AOQ, ASS and ATI are found
for different p ' values. After that in every situation the graphics with regard of these values are drawn with the
help of function keys (F2*OC, F3=AOQ, F4=ASS, F5=ATT).
As seen in graphic 1 for p'«0.01, the probability of acceptability of parquets in Ardesen Timber Plant is
Pa(p')-0.98L The accepted probabilities for p' values are given under the graphics. According to graphic
2,
Average Outgoing, Quality Limit (AOQL) for parquets is p'=0.03 and AOQ is found as 0.019. For SSP, ASS is
constant and is equal to 100 (See graphic 3). Graphic 4 shows the (p') of AH number change due to party
qualities. At the beginning as ATI curve raises at a low-pace, it shows a high-расе from p'-0.02 to 0.06 and after
that until 1000 a low-pace.
wm
0,00
1,000 a o o o _ 100 _ 1 0 O
1
m
0,01
0,930 0,010
103 _ iio
4
^ :v 0,02
0,877 0,018 . 119 .1
Tv? 0,03
0,020
140
409
|
V.':. ;
0,437'
0,017
lb-3
со?
C7V 0,05
0,230 0.013
153
76i
>
0,06__ o j 51 0,009
M4
064
:|
0 07
‘> , * 2
.... ' 0,006 ” .... 13Э""' ....926""
0,03
“ 6,003 ” i
122
952
|i
0,09
6,021 0,002
114
p.$5i
^ 0,001
- S L J
AOQ
ASS
ATI
Average Outgoing Quality
Average Sample Size
Average Total Inspection
Figure 2. Double Sampling Plan Results
As the program is started up and the data for DSP is input, the values of OC, AOQ, ASS and ATI are found
for different p ' values. After that in every situation the graphics with regard of these values are drawn with the
help of function keys (F2=OC, F3=AOQ, F4=ASS, F5=ATI).
Graph 5. Operating Characteristic Curve
Graph 6. Average Outgoing Quality Curve
18
Научная электронная библиотека ЦНСХБ