


 19 / 736

N: Main group, nt : First sample group, n2 : Second sample group, di : The number of defected items of
the first sample group, c* ; Permitted defected item number, d2 : The number of defected items cf the second
sample group, c*: Permitted defected item number;
Operating
Characteristics
Average
Outgoing
Quality
Average Sample Size
Average Total Inspection
Single
Pa(p')
p ’xPa(p')
n
Pa(p ')xii+(i-Pa(p')*N)
Double
Pa(p')
p'xPa(p*)
nl* n
2
x P(2.$amp!e)) A5S+(N-ni)xF(d>ci)t(rMii-n2)x(l-Pa(p>P(d>C2})
Results and Evaluation
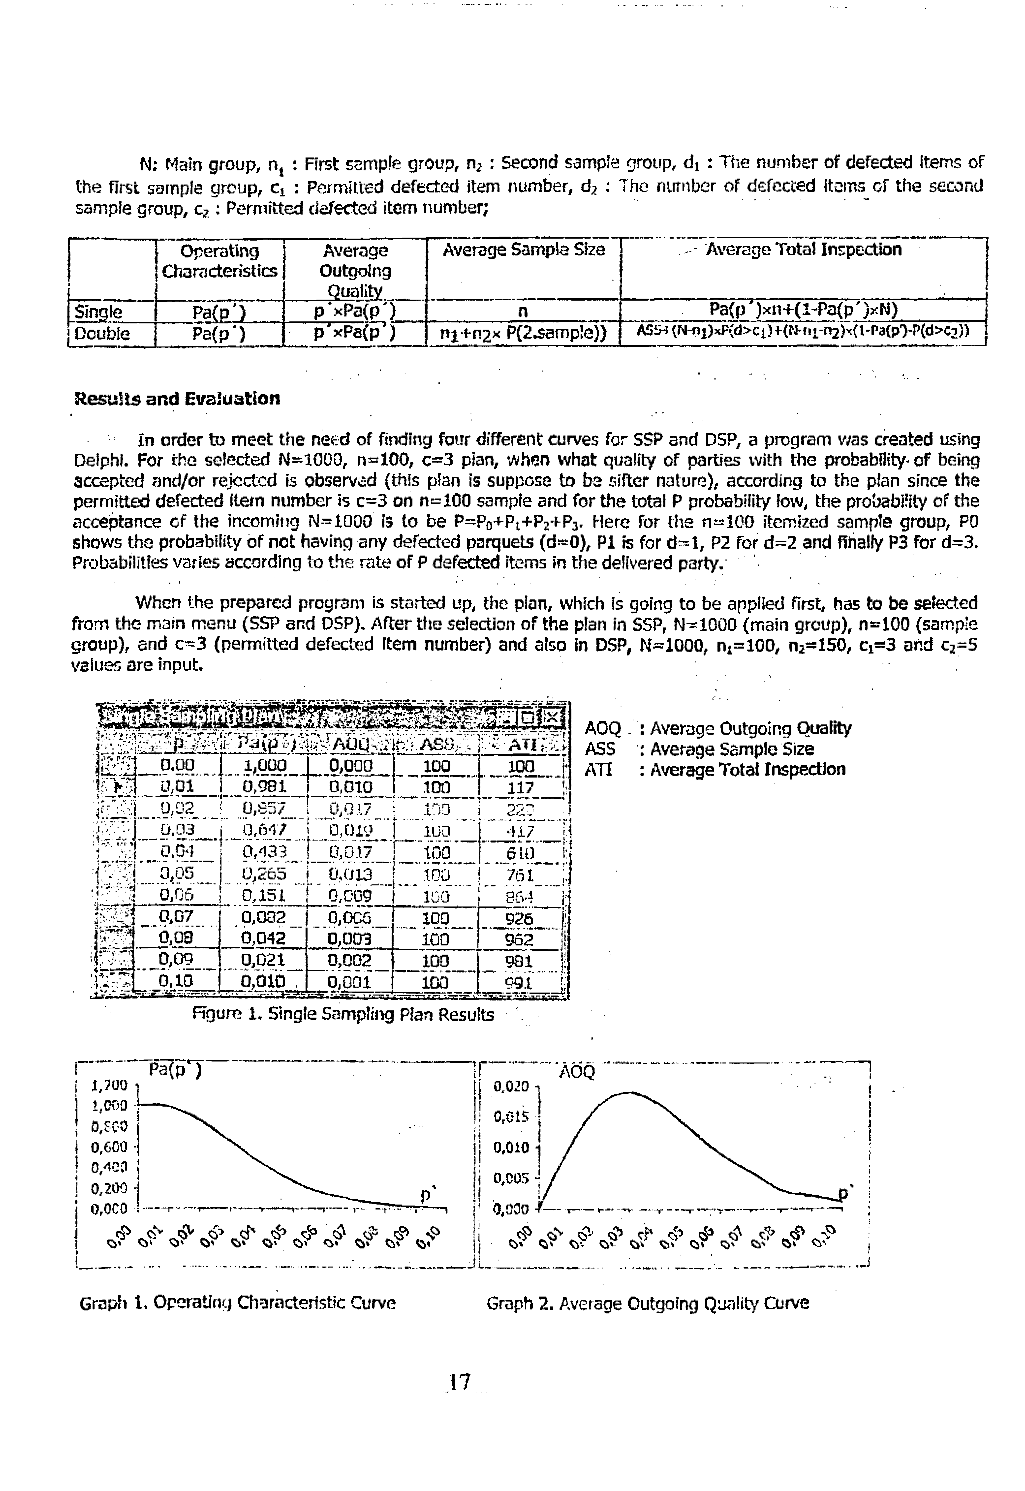
In order to meet the need of finding four different curves for SSP and DSP, a program was created using
Delphi. For the selected N-iOGO, n«100, c-3 pian, when what quality of parties with the probability'of being
accepted and/or rejected is observed (this plan is suppose to be sifter nature), according to the plan since the
permitted defected item number is c=3 on n~100 sample and for the total P probability low, the probability of the
acceptance of the incoming N--1000 is to be Р=Р0+Рг*-Р2тРз. Here for the n^lOO itemized sample group, P0
shows the probability of not having any defected parquets (d^O), PI is for d-1, P2 for d=2 and finally P3 for d=3.
Probabilities varies according to the rate of P defected items in the delivered party.
'
When the prepared program is started up, the plan, which is going to be applied first, has to be selected
from the main menu (SSP and DSP). After the selection of the plan in SSP, N^1000 (main group), n^-lOO (sample
group), end c-3 (permitted defected item number) and also in DSP, N-1000, ni=100, n2-150, ct=3 and c2-5
AOQ . : Average Outgoing Quality
ASS : Average Sample Size
AH : Average Total Inspection
values are input.
J".":ть:
Ш Ш з Ж
0,00 1 1,000 0,000 1
100
100
f
! v 7 6,01 " j 6,981 '"6,010 1
100
J U,b2_ ' i p,857_p_Г 0,017 _ • _mo _ jГ 22?"
•
"6,03' j
_ 1U0 "’"417...
” "6,'см j” о ^ зТ
\ Z m i Z
__100__ 610
i!
'"5,6s' I 0,265 Г аогзГ"
:....
/ o f
! * * " 0,06 ’’ 0,151 Г 0,009
1оГ ’
"
864"...j-
0,07
0,032 iГ 6,6со
100 __ 926_ j;
ГГ""
~’6,оэ" 0,042 ' "о,003
idd
962 “1
0,09
0,021 0,002
100
981
|
ivT ]
o.ib-'
6,010 ,
б;oof
loo"
991
1;
Figure i. Single Sampling Plan Results
17
Научная электронная библиотека ЦНСХБ